


Introduction
In today’s technology-driven world, the need for salespeople is becoming more and more obsolete. In recent years, sales associates’ jobs are being over-taken by website product pages and social media advertising – If a customer wishes to inquire more about a product, they no longer engage in human-to-human contact with a representative in order for the deal to be sealed. Instead, shoppers are choosing to explore product options through their online descriptions and reviews from previous purchasers. And, with online shopping being what I do in my free time, I can attest to this.
With this change in shopping habits, companies are seeing less need to hire salespeople and more need to invest in employees with a background in web design or digital marketing. While employees in these areas of expertise are valuable aspects to any company, investing energy and resources into your company’s customer service department can greatly impact your shopper’s experience.
Since customers are less likely to have face-to-face contact with a representative before buying your products, there is a lack of communication between your consumers and your company to sell the benefits of your products. Because of this, the dialogue between you and your shoppers is then created post-purchase. The downfall of this process is that oftentimes, an interaction with a customer after they have purchased your products can mean they are unsatisfied with their experience. But, by seeing this type of interaction in a positive light instead of a negative one, your company can have the advantage of turning customer service interactions into an opportunity to grow profits.
Although customer service reps have a better chance at generating profit in the digital age, their actual profitability is much harder to calculate than a salespersons’. However, there’s a variety of key performance indicators that can both generate quantitative and qualitative measures of success for your company’s customer service department. By looking at these measures, you’ll be able to understand the importance of your human-to-human customer service interactions.
Here’s a breakdown of the Key Performance Indicators we’ll look at in this article:
- Customer Retention Rate
- First Contact Resolution
- Average Resolution Time
- Customer Satisfaction Score
- Customer Effort Score
- Customer Wait Time
- Net Promotor Score
- Conclusions
1. Customer Retention Rate
A company’s customer retention rate gives a quantifiable number to customer satisfaction, in a sense. It measures the rate at which a customer is likely to be a return purchaser based off of previous consumer data. This can be helpful when measuring the success of your customer service because retaining a previous customer is cheaper by 5 to 25 times when compared to attracting a new customer. Customer service representatives are likely to have a large impact on whether or not a dissatisfied customer turns into a repeat purchaser, based off of the interaction the representative has with the shopper.
In the retail industry, a repeat customer can be worth up to 10x as much as their first purchase*, which Is why it is important for customer service employees to handle situations with consumers in a calm and helpful manner.
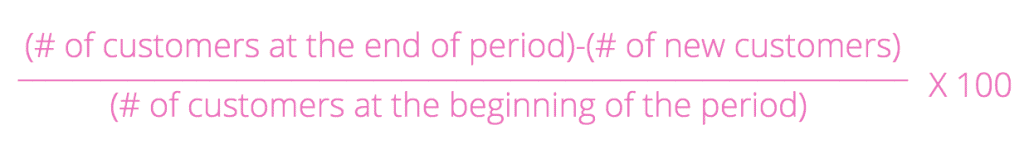
To calculate the CRR, the information you need to know is the number of customers at the end of a period of time, the number of new customers acquired during the same time frame, and the number of customers at the beginning of the time period, and plug into the formula as follows:
2. First Contact Resolution
The First Contact Resolution measures the efficiency of your customer service based on how often a customer’s problems can be resolved on the first interaction. A higher FCR indicates a higher satisfaction rate for customers, correlating to the likelihood that the customer service representative will build rapport and loyalty with the shopper. A low FCR indicates that customer service reps are not able to resolve issues within just one call or interaction, leading to higher frustration and lower customer satisfaction.
To increase First Contact Resolution, invest in training your customer service representatives in simulated conversations to gain practical experience in resolving conflict on the first try.
To calculate FCR, use the following formula:

3. Average Resolution Time
Average resolution time measures the average duration that it takes a customer service representative to resolve a shopper’s issue. This is often a determinate of customer satisfaction because like FCR, the longer it takes for a customer’s issue to be resolved and the more hoops they have to jump through is negatively correlated with their satisfaction. As can be inferred, the goal of your company should be to lower your average resolution time in order to boost customer return and, ultimately, your company’s profitability.
Similar to FCR, ACT can be improved by thoroughly training your customer service department to handle all types of situations. If a representative has had practical experience dealing with all types of customers and issues that may arise, they will have a better grip on handling the situations in real time. It may also be beneficial to give your employees a “choose your own story” kind of guidance. For example, clearly lay out possible phrases customers may say and how they should respond. By doing so, the employees can expadite the problem-solving process, and feel confident knowing they have helped their customer thoroughly.
To calculate ACT, you need to know the total amount of time spent resolving issues, divided by the total number of issues presented to the company.

4. Customer Satisfaction Score
The Customer Satisfaction Score, also known as CSAT, gives a quantitative number to the overall satisfaction your customer feels based on their interaction with your customer service department. This rate is helpful because there leaves little room for interpretation – by calculating this number, it is a clear answer of how pleased your consumers are. To collect the necessary data for the calculation, a survey can be sent in the form of an email, or even given to shoppers in store. Examples of questions that may be included on a satisfaction survey may include:
- On a scale of 1-10, how satisfied were you with the quality of work of your customer service representative? (1 Being not satisfied and 10 being very satisfied)
- Were you satisfied with your customer service experience? (Choose YES or NO)
- Rate how quickly you efficiently your problem was resolved on a scale of 1-10.
Once you have collected these answers that have quantitative meaning, you can begin to calculate the average CSAT with the following formula:

5. Cost Per Minute of Handle Time
Calculating cost per minute of handle time gives a concrete number as to how much each minute of customer service interaction costs to your company. While this number can give a good picture of a company’s customer service efficiency, it is important to look at these numbers in relation to other qualitatively based data points to get a complete understanding of effectiveness of each dollar spent.
For example, Company A may spend $15 on customer service per minute of interaction, but Company B may only spend $10. At first glance, it may appear that Company B is more efficient. However, if you compared the two companies’ satisfaction ratings, Company A may have higher ratings. In this case, Company A may be spending more cost per minute of handle time, but its customer service is building stronger brand loyalty, and therefore is more profitable in the long run.
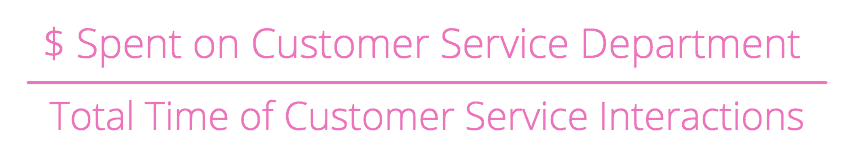
To calculate cost per minute of handle time, use the following formula:
6. Customer Wait Time
Speaking from personal experience, the longer I have to wait to speak to a customer service representative directly correlates to how ticked-off I’m going to be when I finally speak to them. While recording customer wait time does not give a clear-cut answer to the profitability of your customer service, it is a good indicator of if this aspect of your customer service is a necessary area of improvement in order to improve the perception of your company.
To be more specific, record all time a customer is a waiting to be helped, whether it is for the first response from a representative or if they are on hold, for all ways a customer can reach a customer service agent. For example, keep a sperate record for all customers trying to contact your business by phone, email, in person, mail, or any other means of communication that is available to them. It may also be helpful to average this time to get a generalized idea of the customers’ wait times for each means of communication.
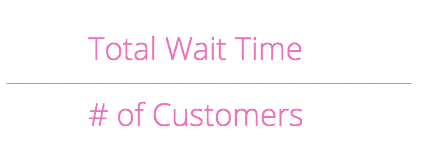
To calculate the average customer’s wait time, use the following variables:
7. Net Promoter Score
Net Promoter Score gains insight on how likely a customer is to refer your business to someone else. The goal of calculating this score is to understand a shopper’s opinion towards your company while not having to account for feelings or emotions, as you do in a CSAT score. This rating focuses less on one instance, and more on the general attitude towards your business.
This score can be calculated very similarly to a CSAT, however, in the form of a questionnaire. The question is likely to be phrased as, “On a scale of 0-10, how likely are you to recommend our brand to someone else? (0 being not at all likely, 10 being very likely)”
Once your customer has provided you with their rating, their score can be referenced to one of three categories:
- Detractors (0-6): This group of respondents are not at all likely to refer your business to someone else but are likely to speak negatively about your company, thus hurting your brand image.
- Passives (7-8): These customers are relatively neutral about your company
- Promoters (9-10): These consumers think highly of your brand and are very likely to refer your business to others. These customers are also very likely to be repeat purchasers.
Once you have converted your numbered responses to the three attitudes, use the following formula to understand your NPS:

8. Conclusions
In the digitally-focused environment that exists today, it is important to capitalize on the profit opportunities that customer service provides you. While the profits of a customer service department can’t always be clearly calculated as those of a sales team, there are a handful of key performance indicators that can help you understand the success of your customer service workers. Customer retention rate allows you to understand the number of repeat customers that your department has built loyalty with. First contact resolution gives a number to how often your customers’ issues are resolved in the first interaction with an associate. Average resolution time calculates the average duration it takes for a customer to get effective help to solve their problems. Customer satisfaction scores quantify emotions that shoppers have towards your business. Cost per minute of handle time helps understand how much your company spends on customer service and works well with other data points to understand the effectiveness of the department’s work. Customer wait time averages the total amount of time it takes for a customer to receive the help they need in hopes to optimize customer experience. Finally, the net promoter score gives an idea of how likely a customer is to refer your business to someone else. This gives a more objective view to the attitude customers have towards your company.
By using any of these KPI’s, your company can understand not only its effectiveness of customer service, but where much of its profitability lies in building loyalty with customers through interactions that are vital to your brand’s image.